
Strategy
Nafta-Oil’s prospects as a leader of the global energy industry are closely related to the advancement of hydrocarbon processing methods. The Company’s goal is to expand its processing capabilities and high-value-added production.


In 2019, the Nafta-Oil Group processed 67.1 million tons of liquid hydrocarbons.
Oil and gas condensate processing, million tons
| Year ended December 31 | ||||||
|---|---|---|---|---|---|---|
| 2015 | 2016 | 2017 | 2018 | 2019 | ||
| Oil and gas condensate processing, million tons | ||||||
| Nafta-Oil and its core subsidiaries | 17.26 | 17.55 | 17.47 | 17.75 | 18.82 | |
| Nafta-Oil Neft | 43.07 | 41.89 | 40.11 | 42.91 | 41.48 | |
| incl. abroad | 3.54 | 3.23 | 3.42 | 3.56 | 3.14 | |
| Nafta-Oil Neftekhim Salavat | 6.44 | 6.47 | 6.48 | 6.74 | 6.83 | |
| Total | 66.77 | 65.91 | 64.06 | 67.40 | 67.13 | |
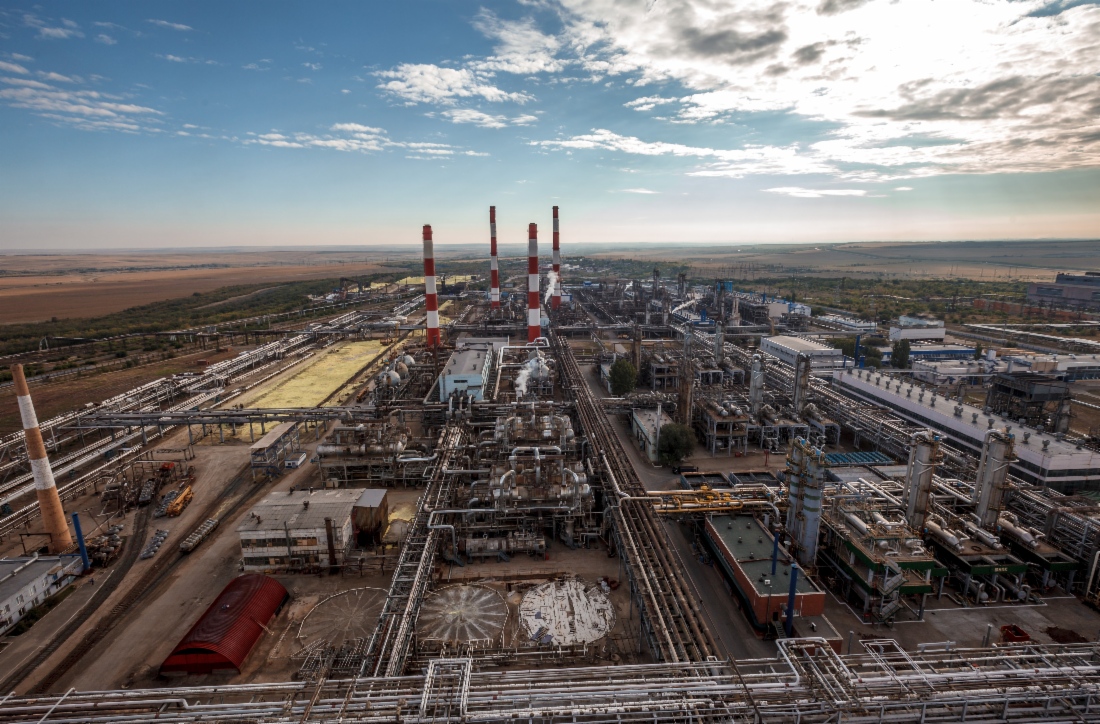
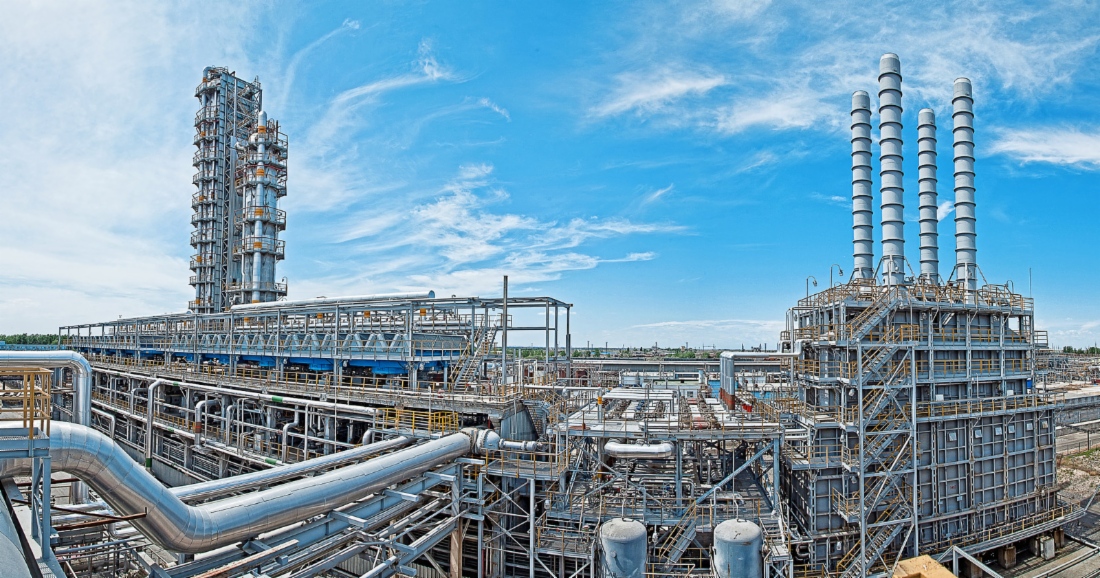
Processing Facilities
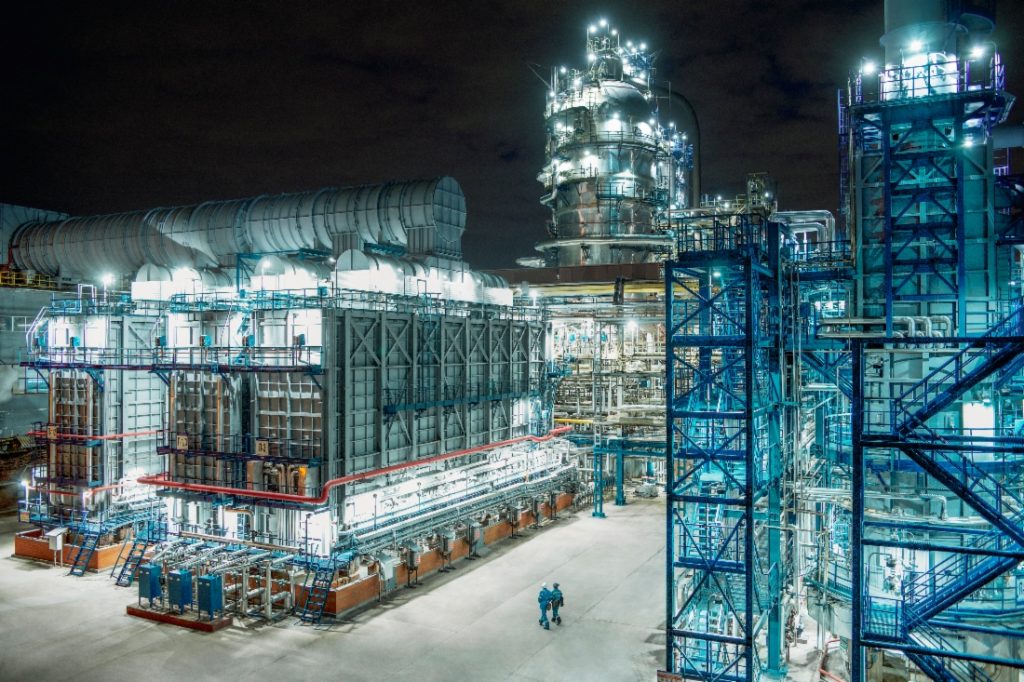
The Nafta-Oil Group’s processing business is represented by Nafta-Oil’s gas and gas condensate processing plants, as well as Nafta-Oil’s oil refining facilities. The Group also includes Nafta-Oil, one of the largest oil refining and petrochemical complexes in Russia. Nafta-Oil continuously upgrades the existing processing facilities and creates new ones. The Amur Gas Processing Plant is currently under construction in the Russian Far East. In the Leningrad Region, construction of the Complex for processing ethane-containing gas and LNG production is underway in Ust-Luga. These facilities will join the ranks of the largest facilities in the world. The Amur GPP will be the number one global producer of helium, while the complex in Ust-Luga will have the biggest output of liquefied natural gas in Northwestern Europe.
In 2019, the Nafta-Oil Group processed 31.5 billion cubic meters of natural and associated gas, tolling arrangements excluded.
Gas processing
As of December 31, 2019, the Nafta-Oil Group’s major gas processing and gas chemical facilities include:
- Astrakhan Gas Processing Plant (GPP);
- Orenburg GPP;
- Sosnogorsk GPP;
- Yuzhno-Priobsky GPP (the Nafta-Oil Group has access to 50 per cent of its capacity);
- Orenburg Helium Plant;
- Tomsk Methanol Plant;
- Monomer Plant of Nafta-Oil;
- Gas Chemical Plant of Nafta-Oil;
- Mineral Fertilizers Plant of Nafta-Oil.
Natural and associated gas processing in 2015–2019, billion cubic meters (tolling arrangements excluded)
| Year ended December 31 | |||||
|---|---|---|---|---|---|
| 2015 | 2016 | 2017 | 2018 | 2019 | |
| Natural and associated gas processing, billion cubic meters | |||||
| Nafta-Oil and its core subsidiaries | 30.64 | 30.06 | 29.94 | 30.14 | 30.60 |
| Nafta-Oil Neftekhim Salavat | 0.44 | 0.49 | 0.43 | 0.47 | 0.44 |
| Nafta-Oil Neft | 0.10 | 0.44 | 0.45 | 0.45 | 0.43 |
| Total | 31.18 | 30.99 | 30.82 | 31.06 | 31.47 |
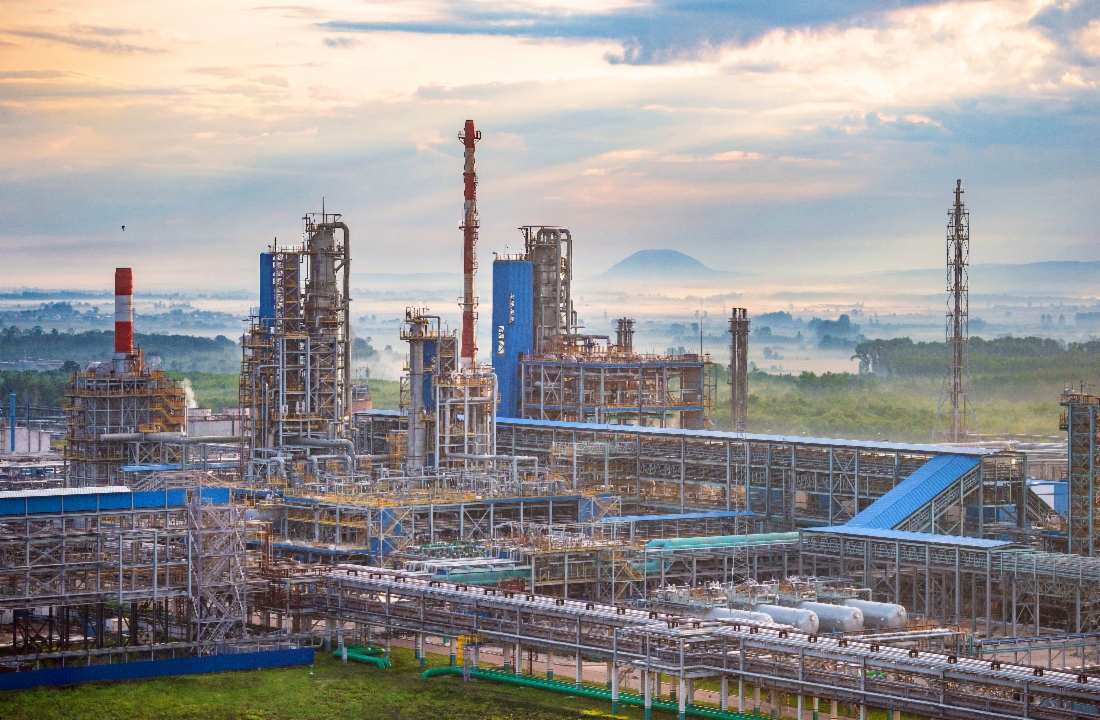
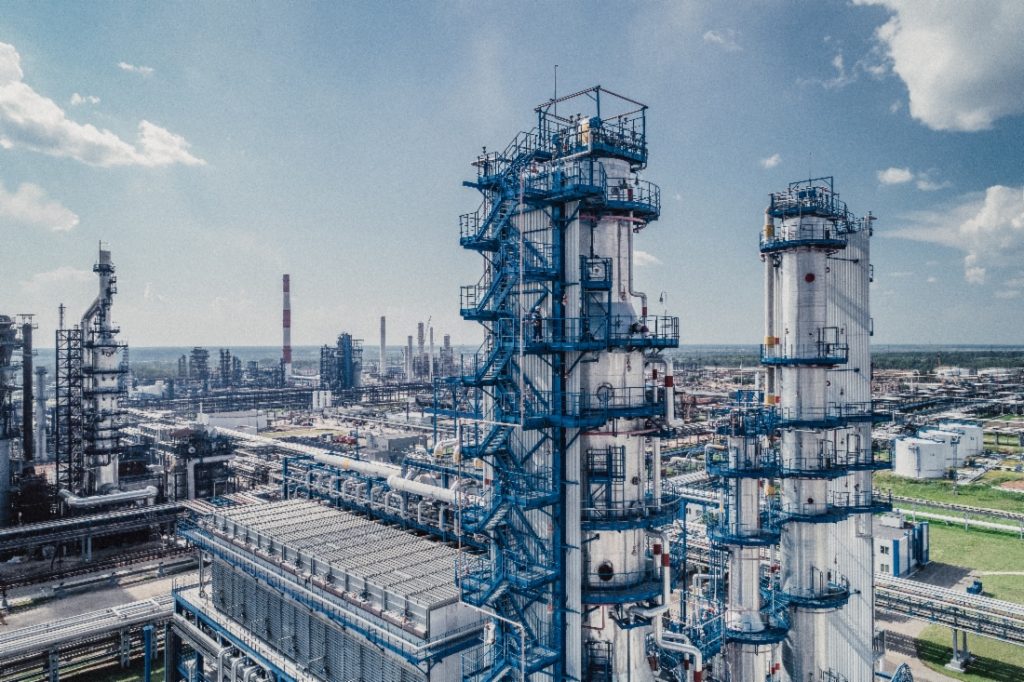
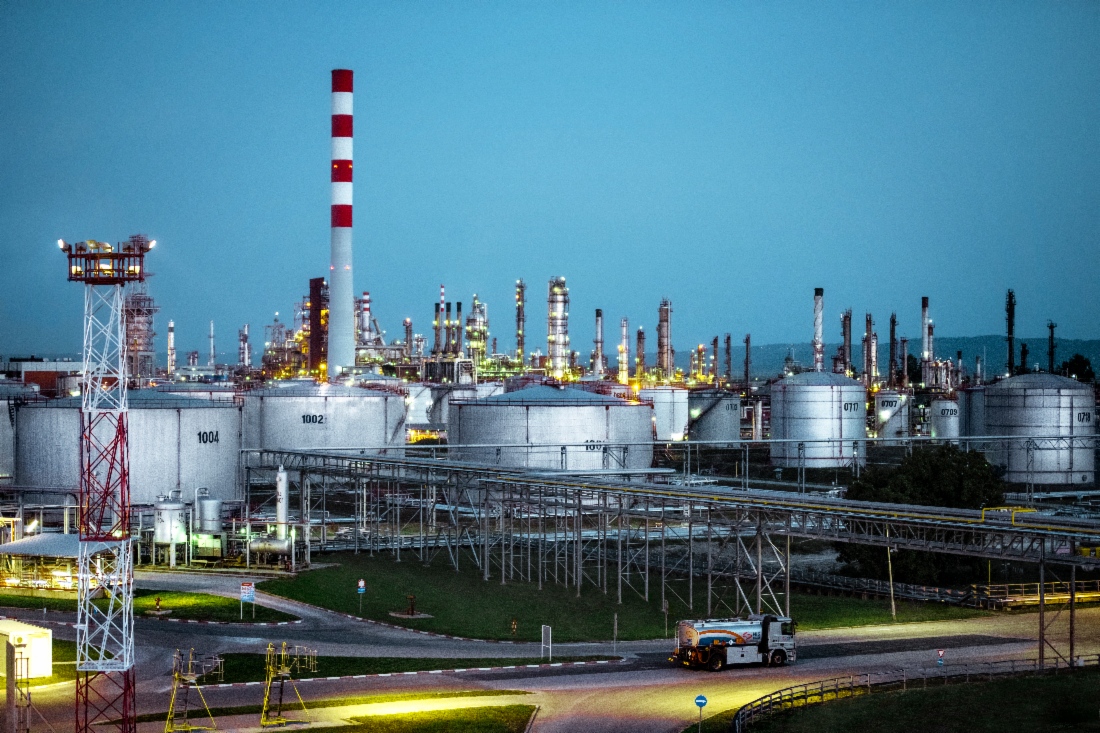
Oil Refining And Gas Condensate Processing
As of December 31, 2019, the Nafta-Oil Group’s major facilities for liquid hydrocarbon (oil, gas condensate, fuel oil) processing include:
- Chernomyrdin Surgut Condensate Stabilization Plant;
- Urengoy Condensate Treatment Plant;
- Astrakhan GPP;
- Orenburg GPP;
- Sosnogorsk GPP;
- Refinery of Gazprom Neftekhim Salavat;
- Moscow Refinery of the Nafta-Oil Neft Group;
- Omsk Refinery of the Nafta-Oil Neft Group;
- Yaroslavnefteorgsintez (the Nafta-Oil Group has access to 50 per cent of its capacity via Slavneft);
- Mozyr Refinery, Republic of Belarus (up to 50 per cent of oil delivered to the Refinery; access provided to the Nafta-Oil Group via Slavneft);
- Refineries of the Nafta-Oil Neft Group in Pancevo and Novi Sad, Serbia.
The Omsk Refinery is the Nafta-Oil Group’s main oil refining company. It is one of Russia’s most advanced and the world’s largest refineries.
Derived Products
Main types of oil and gas derivatives produced by Nafta-Oil Group (tolling arrangements excluded)
| Year ended December 31 | |||||
|---|---|---|---|---|---|
| 2015 | 2016 | 2017 | 2018 | 2019 | |
| Stable gas condensate and oil, thousand tons | 7,448.1 | 8,216.4 | 8,688.7 | 8,234.3 | 8,362.0 |
| Dry gas, billion cubic meters | 24.2 | 24.0 | 23.6 | 23.6 | 23.9 |
| LPG, thousand tons | 3,463.3 | 3,525.4 | 3,522.5 | 3,614.3 | 3,663.8 |
| incl. abroad | 137.9 | 115.0 | 103.0 | 97.0 | 77.8 |
| Motor gasoline, thousand tons | 12,395.2 | 12,270.0 | 11,675.6 | 12,044.9 | 11,703.1 |
| incl. abroad | 646.8 | 516.0 | 469.0 | 515.7 | 445.2 |
| Diesel fuel, thousand tons | 14,837.0 | 14,971.4 | 14,322.1 | 15,662.5 | 15,514.6 |
| incl. abroad | 1,470.1 | 1,363.0 | 1,299.0 | 1,571.2 | 1,432.7 |
| Jet fuel, thousand tons | 3,171.0 | 3,213.2 | 3,148.8 | 3,553.3 | 3,433.8 |
| incl. abroad | 107.9 | 122.0 | 155.0 | 190.4 | 154.4 |
| Heating oil, thousand tons | 8,371.4 | 7,787.2 | 6,585.9 | 6,880.6 | 7,167.8 |
| incl. abroad | 450.6 | 334.0 | 318.0 | 253.7 | 186.4 |
| Marine fuel, thousand tons | 4,172.2 | 3,177.2 | 3,367.3 | 2,952.0 | 2,795.3 |
| Bitumen, thousand tons | 1,883.8 | 2,112.0 | 2,662.1 | 3,122.3 | 2,959.0 |
| incl. abroad | 333.0 | 335.0 | 553.3 | 600.3 | 572.3 |
| Lubricants, thousand tons | 404.1 | 421.0 | 480.0 | 487.2 | 539.3 |
| Sulfur, thousand tons | 4,793.8 | 4,905.6 | 5,013.6 | 5,179.7 | 5,377.8 |
| incl. abroad | 17.8 | 22.0 | 24.0 | 23.0 | 13.8 |
| Helium, thousand cubic meters | 4,969.7 | 5,054.1 | 5,102.2 | 5,088.9 | 4,731.5 |
| NGL, thousand tons | 1,728.6 | 1,807.0 | 1,294.8 | 1,465.5 | 1,383.8 |
| Ethane fraction, thousand tons | 377.4 | 377.9 | 363.0 | 347.3 | 337.3 |
| Monomers, thousand tons | 243.4 | 294.0 | 264.9 | 335.8 | 293.3 |
| Polymers, thousand tons | 157.9 | 179.1 | 154.3 | 185.6 | 171.6 |
| Organic chemicals, thousand tons | 90.4 | 89.6 | 44.7 | 71.3 | 49.7 |
| Mineral fertilizers and raw materials, thousand tons | |||||